One number, and how we got it
Each card here takes one figure from India's public data and sets it beside another. Every figure is computed from the sources listed under it, and the table shows the working for every state, so you can check it or use it.
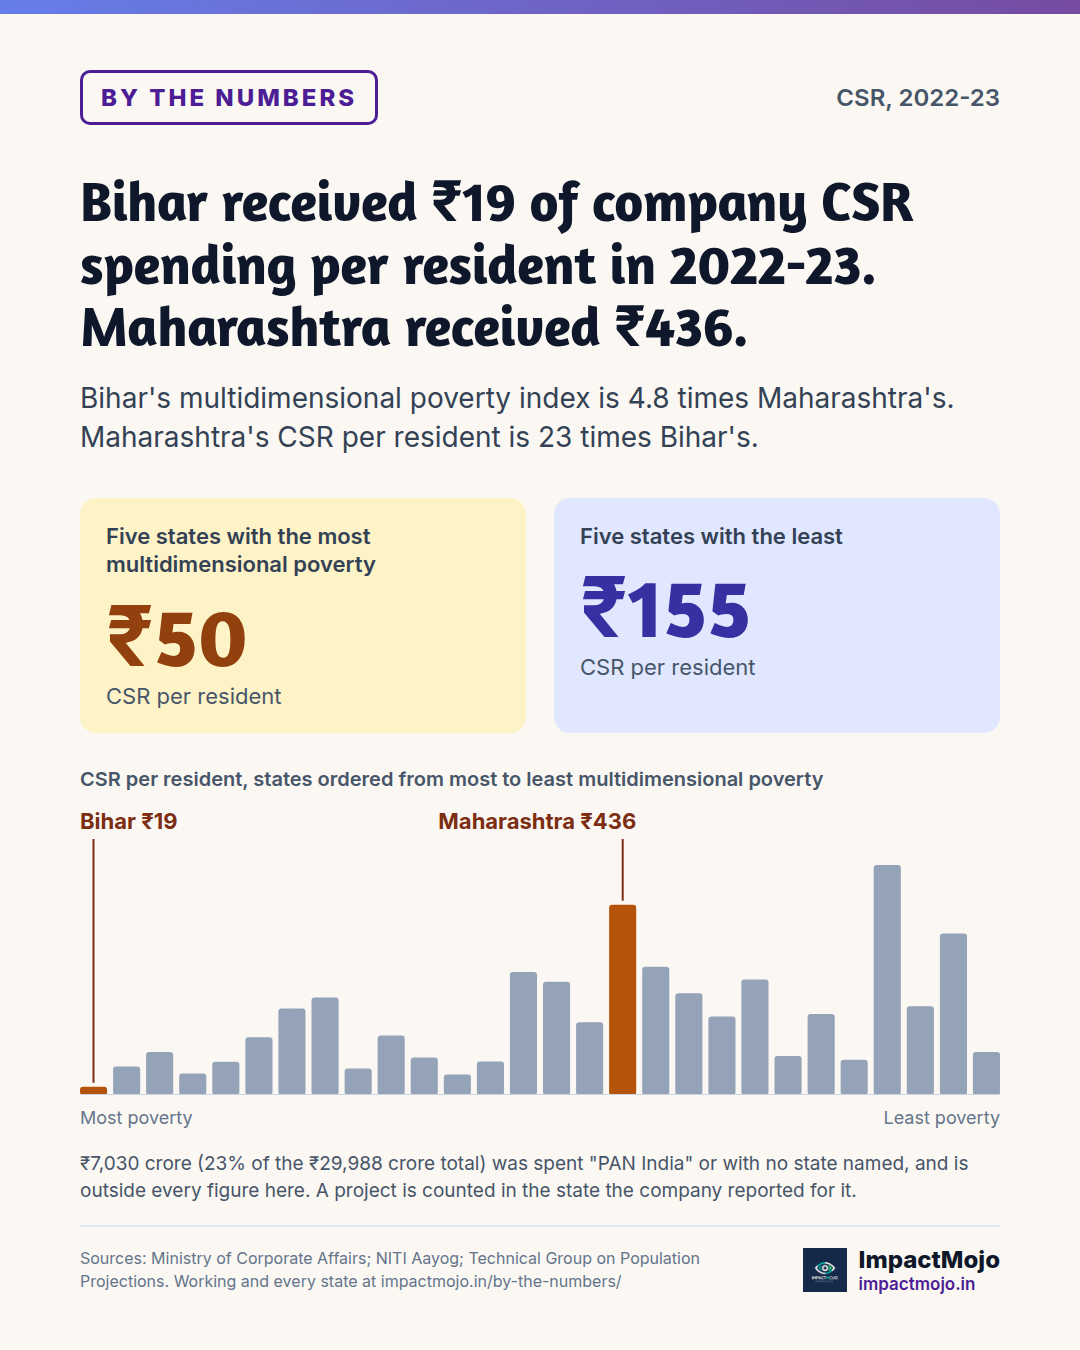
Bihar received ₹19 of company CSR spending per resident in 2022-23. Maharashtra received ₹436.
Bihar's multidimensional poverty index is 4.8 times Maharashtra's. Maharashtra's CSR per resident is 23 times Bihar's.
How it is worked out
- CSR per resident is a state's 2022-23 CSR spending divided by its projected population on 1 October 2022, the middle of the financial year.
- States are ranked by NITI Aayog's multidimensional poverty index (MPI) for 2019-21, and where two share an MPI at the three decimals NITI prints, by the share of people who are poor (the headcount ratio). That decides Himachal Pradesh and Punjab.
- The five-state figures pool spending and population across the five, so a small state does not count as much as a large one.
- The ₹7,030 crore recorded as "PAN India", "PAN India (Other Centralized Funds)" or "NEC/Not Mentioned" is not assigned to any state and is left out. Spreading it by population would raise every state by the same amount per resident and change none of the ranks.
- The CSR Explorer divides by the 2011 census, the last count taken, so its per-resident figures run higher than these for fast-growing states.
- The ministry records the state the company reported for each project. A company headquartered in Mumbai can report national work as Maharashtra's, so part of the gap measures where companies are based.
Every state
| State | MPI 2019-21 | CSR 2022-23 (₹ crore) | Population, 1 Oct 2022 | CSR per resident |
|---|---|---|---|---|
| Bihar | 0.160 | 235.4 | 125,991,000 | ₹18.7 |
| Meghalaya | 0.133 | 21.7 | 3,333,000 | ₹65.2 |
| Jharkhand | 0.131 | 388.4 | 39,259,000 | ₹98.9 |
| Uttar Pradesh | 0.103 | 1,152.6 | 234,692,000 | ₹49.1 |
| Madhya Pradesh | 0.090 | 656.4 | 86,149,000 | ₹76.2 |
| Assam | 0.086 | 470.2 | 35,573,000 | ₹132.2 |
| Chhattisgarh | 0.070 | 596.1 | 30,037,000 | ₹198.5 |
| Odisha | 0.070 | 987.7 | 44,237,000 | ₹223.3 |
| Nagaland | 0.066 | 13.6 | 2,223,000 | ₹61.0 |
| Rajasthan | 0.065 | 1,102.4 | 80,662,000 | ₹136.7 |
| Arunachal Pradesh | 0.059 | 13.3 | 1,555,000 | ₹85.9 |
| Tripura | 0.056 | 19.3 | 4,128,000 | ₹46.7 |
| West Bengal | 0.050 | 762.3 | 98,884,000 | ₹77.1 |
| Gujarat | 0.050 | 2,008.4 | 71,149,000 | ₹282.3 |
| Uttarakhand | 0.041 | 301.1 | 11,587,000 | ₹259.9 |
| Manipur | 0.034 | 53.5 | 3,209,000 | ₹166.6 |
| Maharashtra | 0.033 | 5,497.3 | 125,979,000 | ₹436.4 |
| Karnataka | 0.031 | 1,985.8 | 67,515,000 | ₹294.1 |
| Haryana | 0.031 | 701.1 | 30,058,000 | ₹233.2 |
| Andhra Pradesh | 0.025 | 954.6 | 53,079,000 | ₹179.9 |
| Telangana | 0.024 | 1,007.5 | 37,999,000 | ₹265.1 |
| Mizoram | 0.024 | 11.0 | 1,233,000 | ₹89.1 |
| Himachal Pradesh | 0.020 | 138.6 | 7,453,000 | ₹186.0 |
| Punjab | 0.020 | 247.6 | 30,649,000 | ₹80.8 |
| Sikkim | 0.011 | 36.2 | 686,000 | ₹527.4 |
| Tamil Nadu | 0.009 | 1,562.5 | 76,765,000 | ₹203.5 |
| Goa | 0.003 | 58.2 | 1,571,000 | ₹370.2 |
| Kerala | 0.002 | 351.6 | 35,716,000 | ₹98.4 |
Sources
- Ministry of Corporate Affairs, State/UT-wise CSR expenditure 2018-19 to 2022-23, Open Government Data Platform, resource 80f3abf8-7c91-4966-a37f-8c7b0aae92e9, 2022-23 column.
- NITI Aayog, National Multidimensional Poverty Index: A Progress Review 2023, Overview of States and UTs, p. 36; MPI from NFHS-5 (2019-21).
- Technical Group on Population Projections, Population Projections for India and States 2011-2036 (MoHFW, November 2019), Table 14, projected population on 1 October 2022, pp. 121-136.
More in the CSR Explorer.
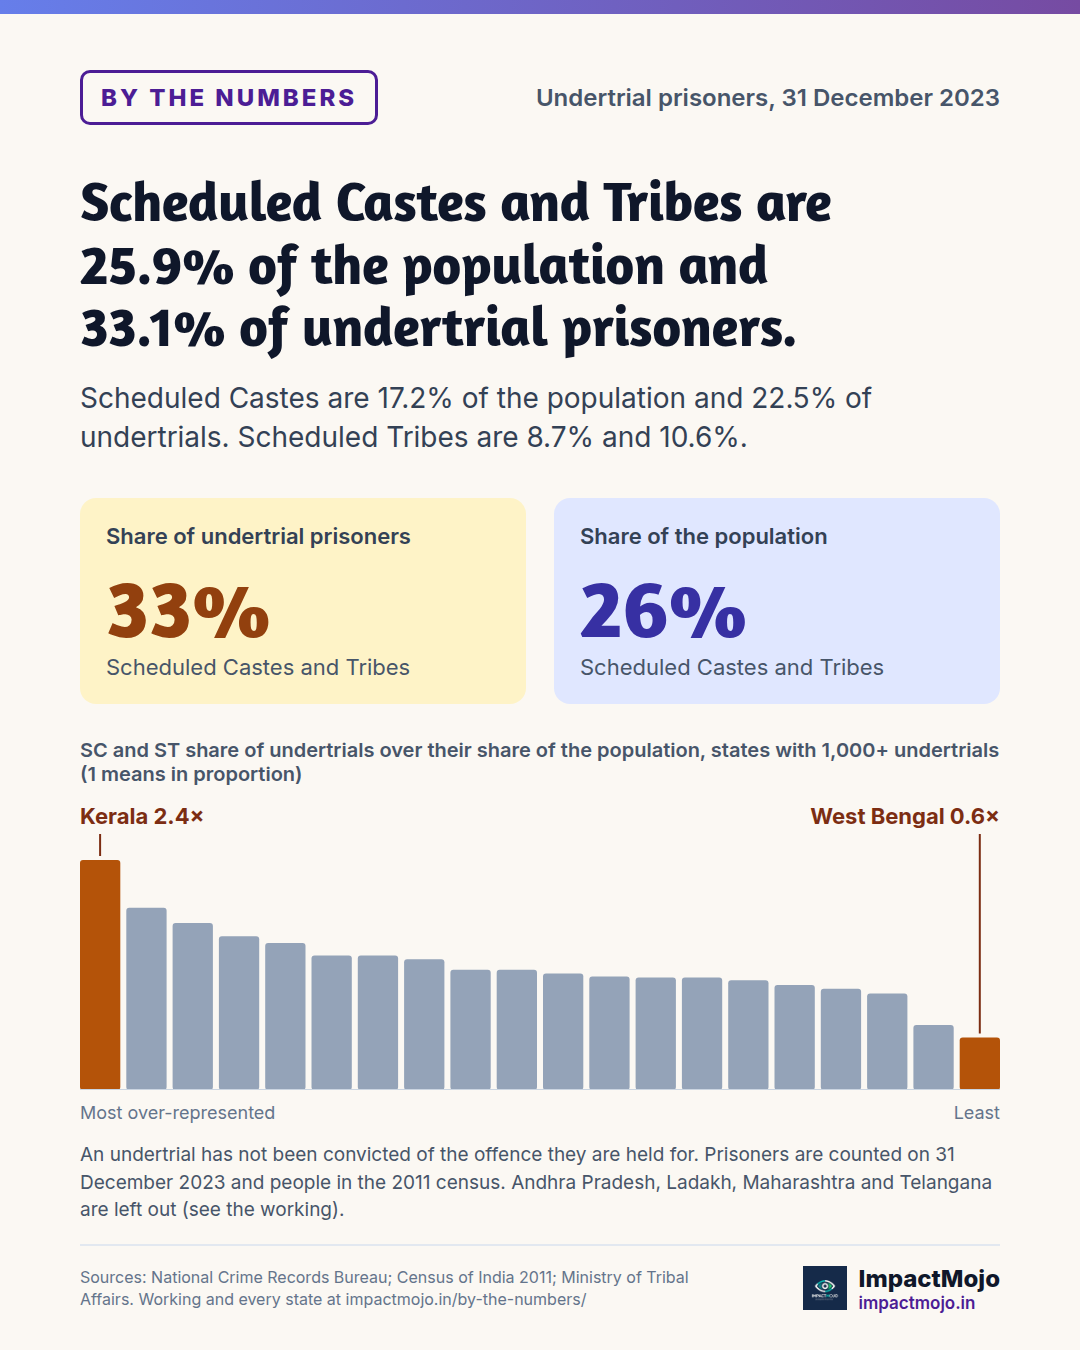
Scheduled Castes and Tribes are 25.9% of the population and 33.1% of undertrial prisoners.
Scheduled Castes are 17.2% of the population and 22.5% of undertrials. Scheduled Tribes are 8.7% and 10.6%.
How it is worked out
- A state's share is its Scheduled Caste and Scheduled Tribe undertrials divided by all its undertrials whose caste the prison recorded.
- The population share is the state's Scheduled Caste and Scheduled Tribe population in the 2011 census over its total population. The 2021 census was not held, so 2011 is the latest count.
- The national figures pool prisoners and people across the same states, so both sides cover the same places.
- Maharashtra reported no caste breakdown for its undertrials. Andhra Pradesh and Telangana are left out because the 2011 count covers the undivided state, and Ladakh because it was not a separate unit in 2011.
- Scheduled Tribe population is taken from the Ministry of Tribal Affairs table. The ST column of the combined census table on the same platform is scrambled across rows; the Justice Explorer explains how that was found.
- The chart leaves out states with fewer than 1,000 undertrials whose caste was recorded, where a few dozen people move the ratio a long way. The table shows every state.
- Over-representation among undertrials can come from arrest, from charge, or from who can raise bail. These figures do not say which.
Every state
| State | Undertrials, caste recorded | SC and ST share of undertrials | SC and ST share of population, 2011 | Ratio |
|---|---|---|---|---|
| Kerala | 6,064 | 25.4% | 10.6% | 2.41 |
| Chandigarh | 718 | 37.5% | 18.9% | 1.99 |
| Haryana | 19,292 | 38.5% | 20.2% | 1.91 |
| Goa | 476 | 22.1% | 12.0% | 1.84 |
| Uttarakhand | 4,398 | 37.9% | 21.7% | 1.75 |
| Tamil Nadu | 12,351 | 34.0% | 21.1% | 1.61 |
| Uttar Pradesh | 73,491 | 32.7% | 21.3% | 1.54 |
| Delhi | 17,834 | 23.7% | 16.8% | 1.41 |
| Odisha | 14,778 | 56.4% | 40.0% | 1.41 |
| Karnataka | 11,723 | 33.0% | 24.1% | 1.37 |
| Gujarat | 11,549 | 27.1% | 21.5% | 1.26 |
| Bihar | 46,529 | 21.6% | 17.2% | 1.26 |
| Punjab | 24,503 | 38.9% | 31.9% | 1.22 |
| Puducherry | 304 | 18.8% | 15.7% | 1.19 |
| Assam | 7,546 | 23.3% | 19.6% | 1.19 |
| Jharkhand | 13,584 | 45.4% | 38.3% | 1.18 |
| Rajasthan | 17,263 | 37.1% | 31.3% | 1.18 |
| Chhattisgarh | 11,520 | 49.9% | 43.4% | 1.15 |
| Madhya Pradesh | 22,964 | 40.4% | 36.7% | 1.10 |
| Mizoram | 1,247 | 99.8% | 94.5% | 1.06 |
| Lakshadweep | 3 | 100.0% | 94.8% | 1.05 |
| Arunachal Pradesh | 188 | 70.7% | 68.8% | 1.03 |
| Himachal Pradesh | 1,827 | 31.3% | 30.9% | 1.01 |
| Sikkim | 171 | 38.6% | 38.4% | 1.00 |
| Meghalaya | 881 | 84.6% | 86.7% | 0.98 |
| Nagaland | 432 | 79.4% | 86.5% | 0.92 |
| Manipur | 416 | 37.7% | 44.3% | 0.85 |
| Dadra and Nagar Haveli and Daman and Diu | 134 | 28.4% | 35.1% | 0.81 |
| Tripura | 847 | 38.8% | 49.6% | 0.78 |
| Jammu and Kashmir | 4,568 | 13.1% | 19.3% | 0.68 |
| West Bengal | 20,294 | 16.1% | 29.3% | 0.55 |
| Andaman and Nicobar Islands | 168 | 2.4% | 7.5% | 0.32 |
Sources
- National Crime Records Bureau, Prison Statistics India 2023, State/UT-wise caste of undertrial prisoners as on 31-12-2023, Open Government Data Platform resource 6e069039-64bd-43da-8f5a-15cb697caf1b.
- Census of India 2011, Scheduled Caste population by state, Open Government Data Platform resource c1c221ef-324a-4715-bc02-58172107c162.
- Ministry of Tribal Affairs, State/UT-wise Scheduled Tribe population as per Census 2011, Open Government Data Platform resource a5cd7e55-2e13-4017-9f8c-410dad9cc518.
More in the Justice Explorer.
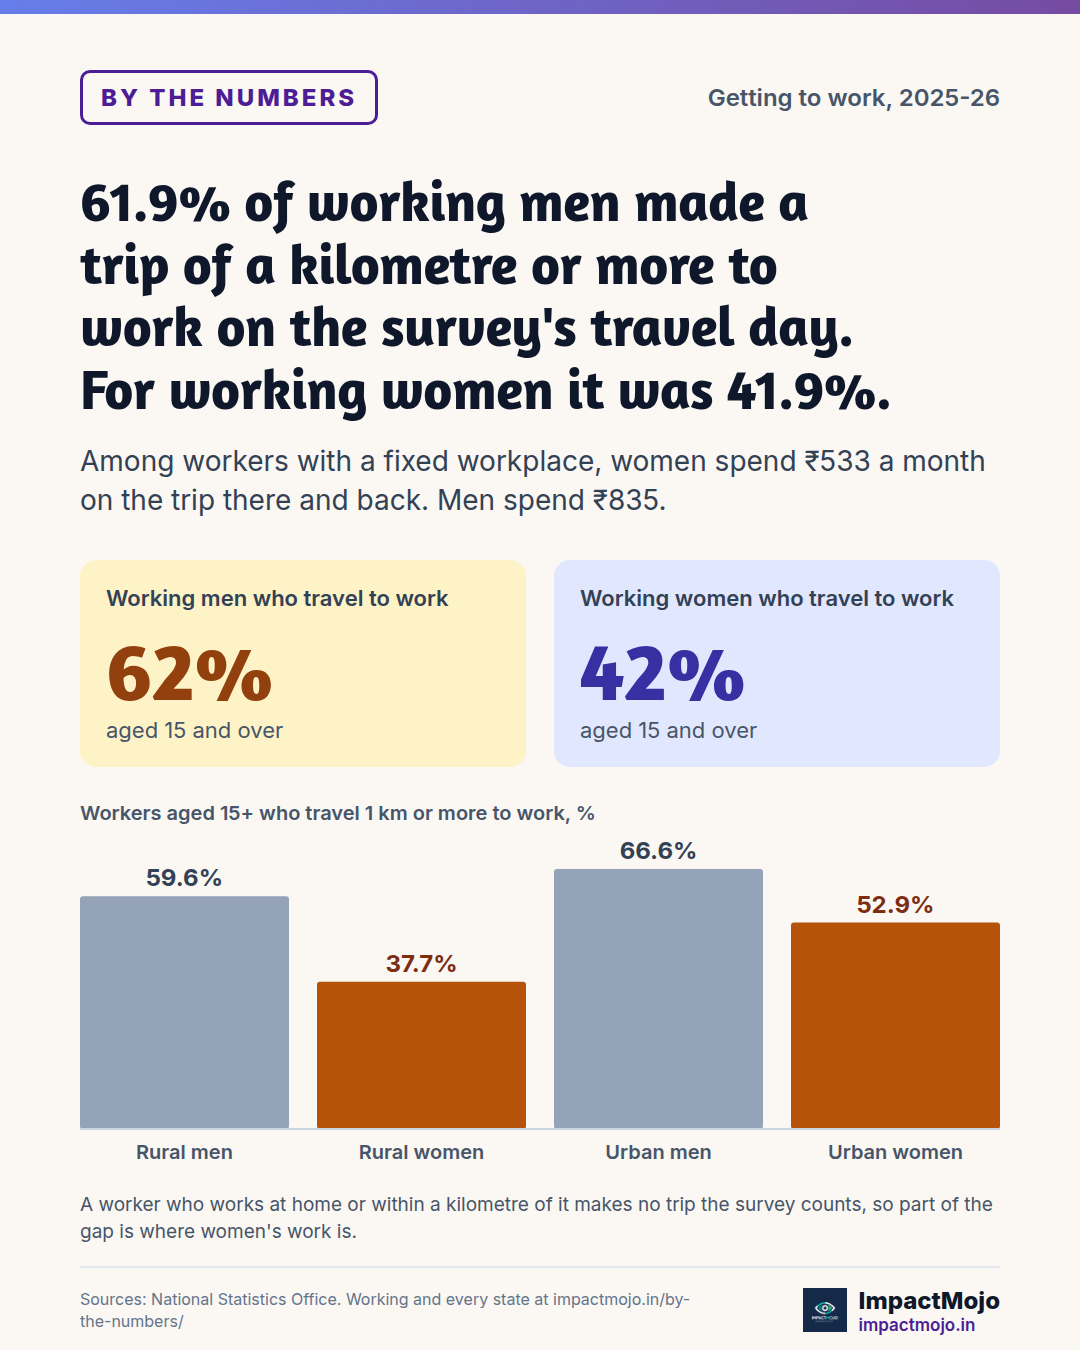
61.9% of working men made a trip of a kilometre or more to work on the survey's travel day. For working women it was 41.9%.
Among workers with a fixed workplace, women spend ₹533 a month on the trip there and back. Men spend ₹835.
How it is worked out
- Workers are people aged 15 and over working in the week before the survey (current weekly status).
- A worker travels if they make a trip of 1 km or more to a fixed or non-fixed workplace on the travel day. Shorter trips were not recorded.
- The monthly cost covers trips to and from a fixed workplace only, so it leaves out workers whose place of work changes.
- The figures are the survey's own estimates for persons, transcribed from the press note's tables. The survey publishes no breakdown by sex for each state.
By sector and sex
| Sector | Men who travel to work | Women who travel to work | Men, monthly cost | Women, monthly cost |
|---|---|---|---|---|
| Rural | 59.6% | 37.7% | ₹674 | ₹307 |
| Urban | 66.6% | 52.9% | ₹1,076 | ₹884 |
| Rural+Urban | 61.9% | 41.9% | ₹835 | ₹533 |
Sources
- National Statistics Office, Ministry of Statistics and Programme Implementation, Government of India, National Household Travel Survey, July 2025 to June 2026: Press Note and Factsheet, Table 3 (workers who travel, by sector, sex and age) and Figure 5 (monthly cost), released 5 October 2026.
More in the Travel Survey Explorer.
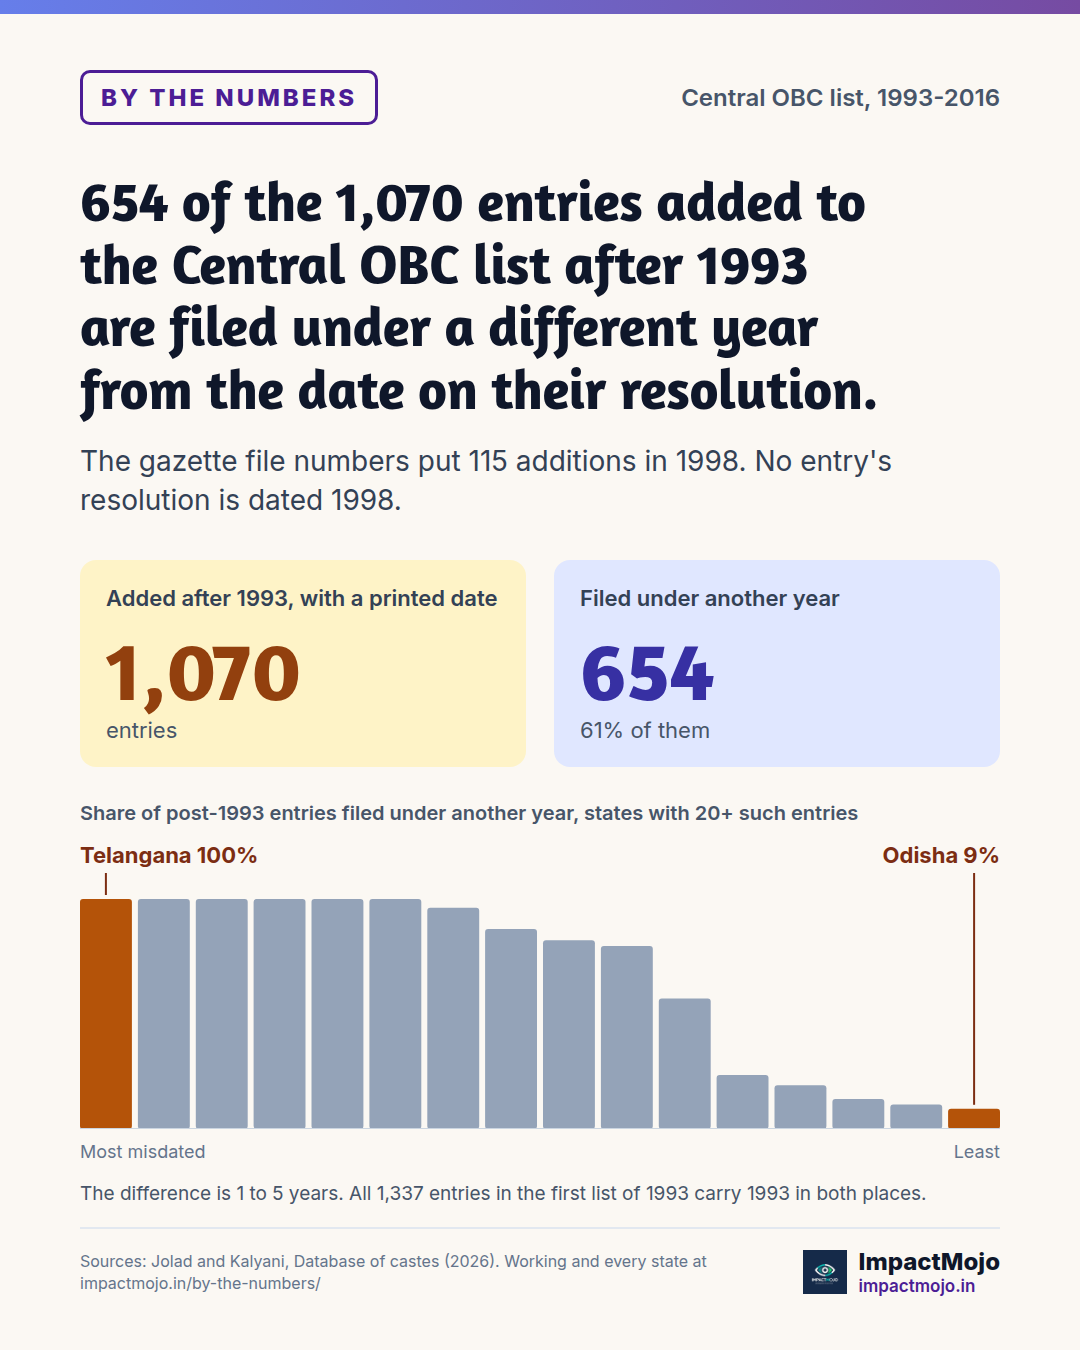
654 of the 1,070 entries added to the Central OBC list after 1993 are filed under a different year from the date on their resolution.
The gazette file numbers put 115 additions in 1998. No entry's resolution is dated 1998.
How it is worked out
- The database records, for each entry, the year in its gazette file number (12011/14/2004-BCC is 2004) and the date printed on the resolution that added it.
- An entry counts as filed under another year when the two years differ. 21 active entries print no date and are left out.
- File 12011/14/2004-BCC, for example, carries a resolution dated 12 March 2007.
- The chart leaves out states with fewer than 20 entries added after 1993. The table shows every state. Every later entry is filed under another year in Chandigarh, Chhattisgarh, Madhya Pradesh, Maharashtra, Puducherry and Telangana.
- A count of castes added each year is right only if it uses the resolution date. Analysis that reads the year off the file number moves the additions back by one to five years.
Every state
| State | Entries added after 1993 | Filed under another year | Share |
|---|---|---|---|
| Telangana | 90 | 90 | 100.0% |
| Chhattisgarh | 89 | 89 | 100.0% |
| Chandigarh | 60 | 60 | 100.0% |
| Puducherry | 57 | 57 | 100.0% |
| Maharashtra | 37 | 37 | 100.0% |
| Madhya Pradesh | 20 | 20 | 100.0% |
| Andhra Pradesh | 15 | 15 | 100.0% |
| Kerala | 11 | 11 | 100.0% |
| Tamil Nadu | 10 | 10 | 100.0% |
| Himachal Pradesh | 7 | 7 | 100.0% |
| Andaman & Nicobar Islands | 5 | 5 | 100.0% |
| Punjab | 4 | 4 | 100.0% |
| Gujarat | 26 | 25 | 96.2% |
| Uttar Pradesh | 23 | 20 | 87.0% |
| Bihar | 14 | 12 | 85.7% |
| Karnataka | 28 | 23 | 82.1% |
| West Bengal | 98 | 78 | 79.6% |
| Goa | 13 | 8 | 61.5% |
| Daman & Diu | 44 | 25 | 56.8% |
| Sikkim | 8 | 3 | 37.5% |
| Haryana | 14 | 5 | 35.7% |
| Rajasthan | 68 | 16 | 23.5% |
| Tripura | 42 | 8 | 19.0% |
| Jammu & Kashmir | 23 | 3 | 13.0% |
| Delhi | 56 | 6 | 10.7% |
| Odisha | 194 | 17 | 8.8% |
| Dadra & Nagar Haveli | 10 | 0 | 0.0% |
| Manipur | 4 | 0 | 0.0% |
Sources
- Jolad, S. and Kalyani, G. (2026), Database of castes: SC, ST, OBC and 1931 Caste Census, Harvard Dataverse, V1.1, OBC list, with the gazette file number and the printed resolution date of every entry.
More in the Caste Lists Explorer.