In a university research methods class, data quality sounds straightforward: use validated instruments, train your enumerators, double-enter everything. In a village in rural Bihar during monsoon season, with an enumerator who has been walking for two hours and a respondent who needs to leave for the fields, data quality becomes an entirely different challenge.
This article addresses the real-world obstacles to data quality that development practitioners face across South Asia and offers practical strategies that actually work in field conditions.
The field is not a laboratory
Most data quality guidance assumes controlled conditions that rarely exist in development fieldwork. The gap between textbook prescriptions and field realities creates specific challenges that practitioners must navigate daily. It helps to have a vocabulary for these problems: the total survey error framework, developed by Robert Groves and refined in the standard reference Survey Methodology (Groves et al.), separates error into distinct sources (coverage, sampling, nonresponse, and measurement) so that each can be diagnosed and addressed rather than lumped together as "bad data."
Environmental factors shape data collection in ways that urban-based programme managers rarely appreciate. Monsoon seasons can make villages inaccessible for weeks. Extreme heat affects both enumerator concentration and respondent patience. Poor lighting in homes makes paper-based tools difficult to use. These conditions are the norm across much of South Asia.
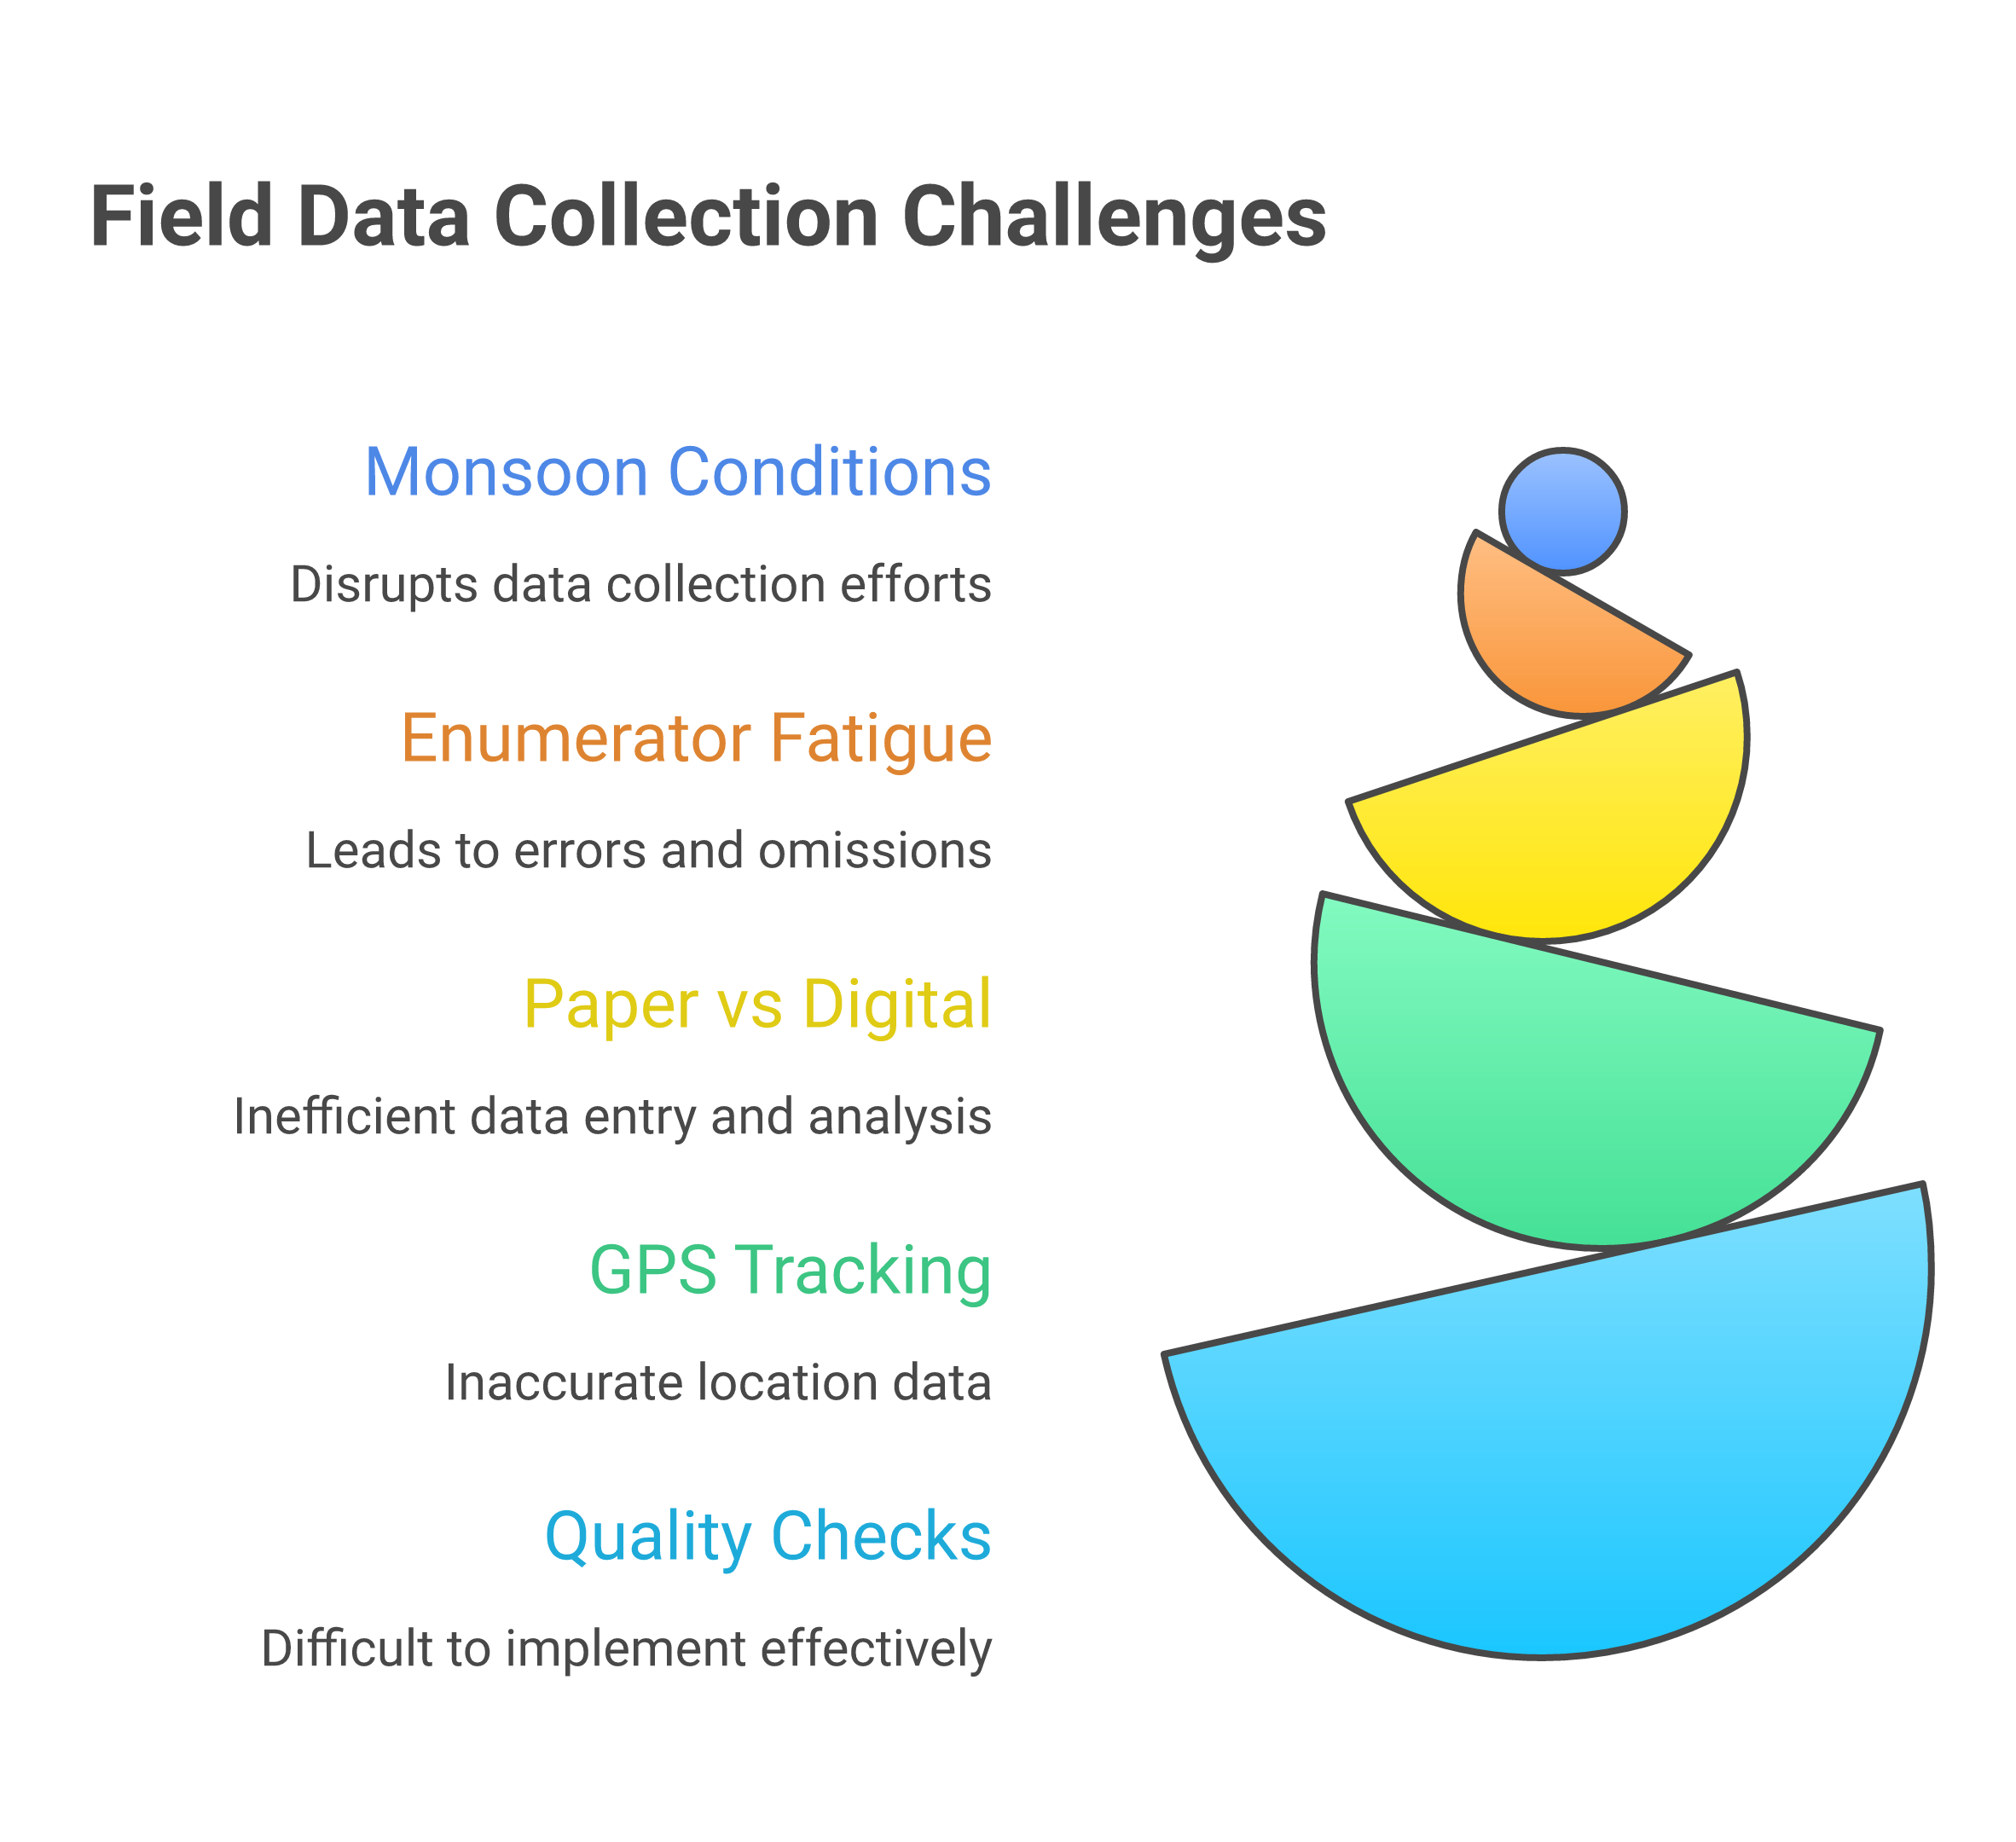
Common data quality threats
Social desirability bias is perhaps the most pervasive threat. Respondents tell you what they think you want to hear: especially when the enumerator represents the organisation providing services. In South Asian contexts, hierarchy and hospitality norms amplify this effect.
Recall bias affects surveys that ask about past behaviour. Can a farmer accurately remember how much fertiliser she used six months ago? The evidence depends heavily on the recall period and the type of data. In a study using agricultural survey data from three African countries, Beegle, Carletto and Himelein found little evidence of large recall bias over lengthy recall periods, and found that more salient events are less subject to recall decay ("Reliability of recall in agricultural data," Journal of Development Economics). The result covers some types of agricultural data, not all, so the practical lesson is still to keep recall windows short and to anchor questions to memorable reference points. Choosing the right indicators can reduce reliance on error-prone recall data.
Enumerator effects include fatigue, shortcutting (fabricating or skipping questions), and inconsistent probing. These are well documented in the survey methodology literature, and the World Bank's Development Impact blog discusses enumerator effects and notes that random audio audits and high-frequency checks are used to reduce fraudulent or low-quality data. One reason teams now routinely track quality metrics by enumerator is that consistency across a field team cannot be assumed.
Some of these threats leave statistical fingerprints. Fabricated or heavily rounded numbers, for instance, tend to depart from Benford's law, the predictable distribution of leading digits in many naturally occurring data sets. The World Bank's blog applies it to a Paraguay agricultural survey, where crop production figures deviated from the expected pattern, suggesting recall difficulties or respondent reluctance, while land and animal data fitted better. A simple digit-frequency test on incoming figures can flag suspect enumerators or sections before the data set is finalised, and is a cheap screen for questions that deserve a closer look.
Red flags for data quality problems
- Suspiciously round numbers (all incomes reported as multiples of 1,000)
- Identical response patterns across multiple respondents
- Survey completion times that are impossibly short
- GPS coordinates that cluster in unexpected locations
- Missing data concentrated in specific enumerators or time periods
Practical strategies that work
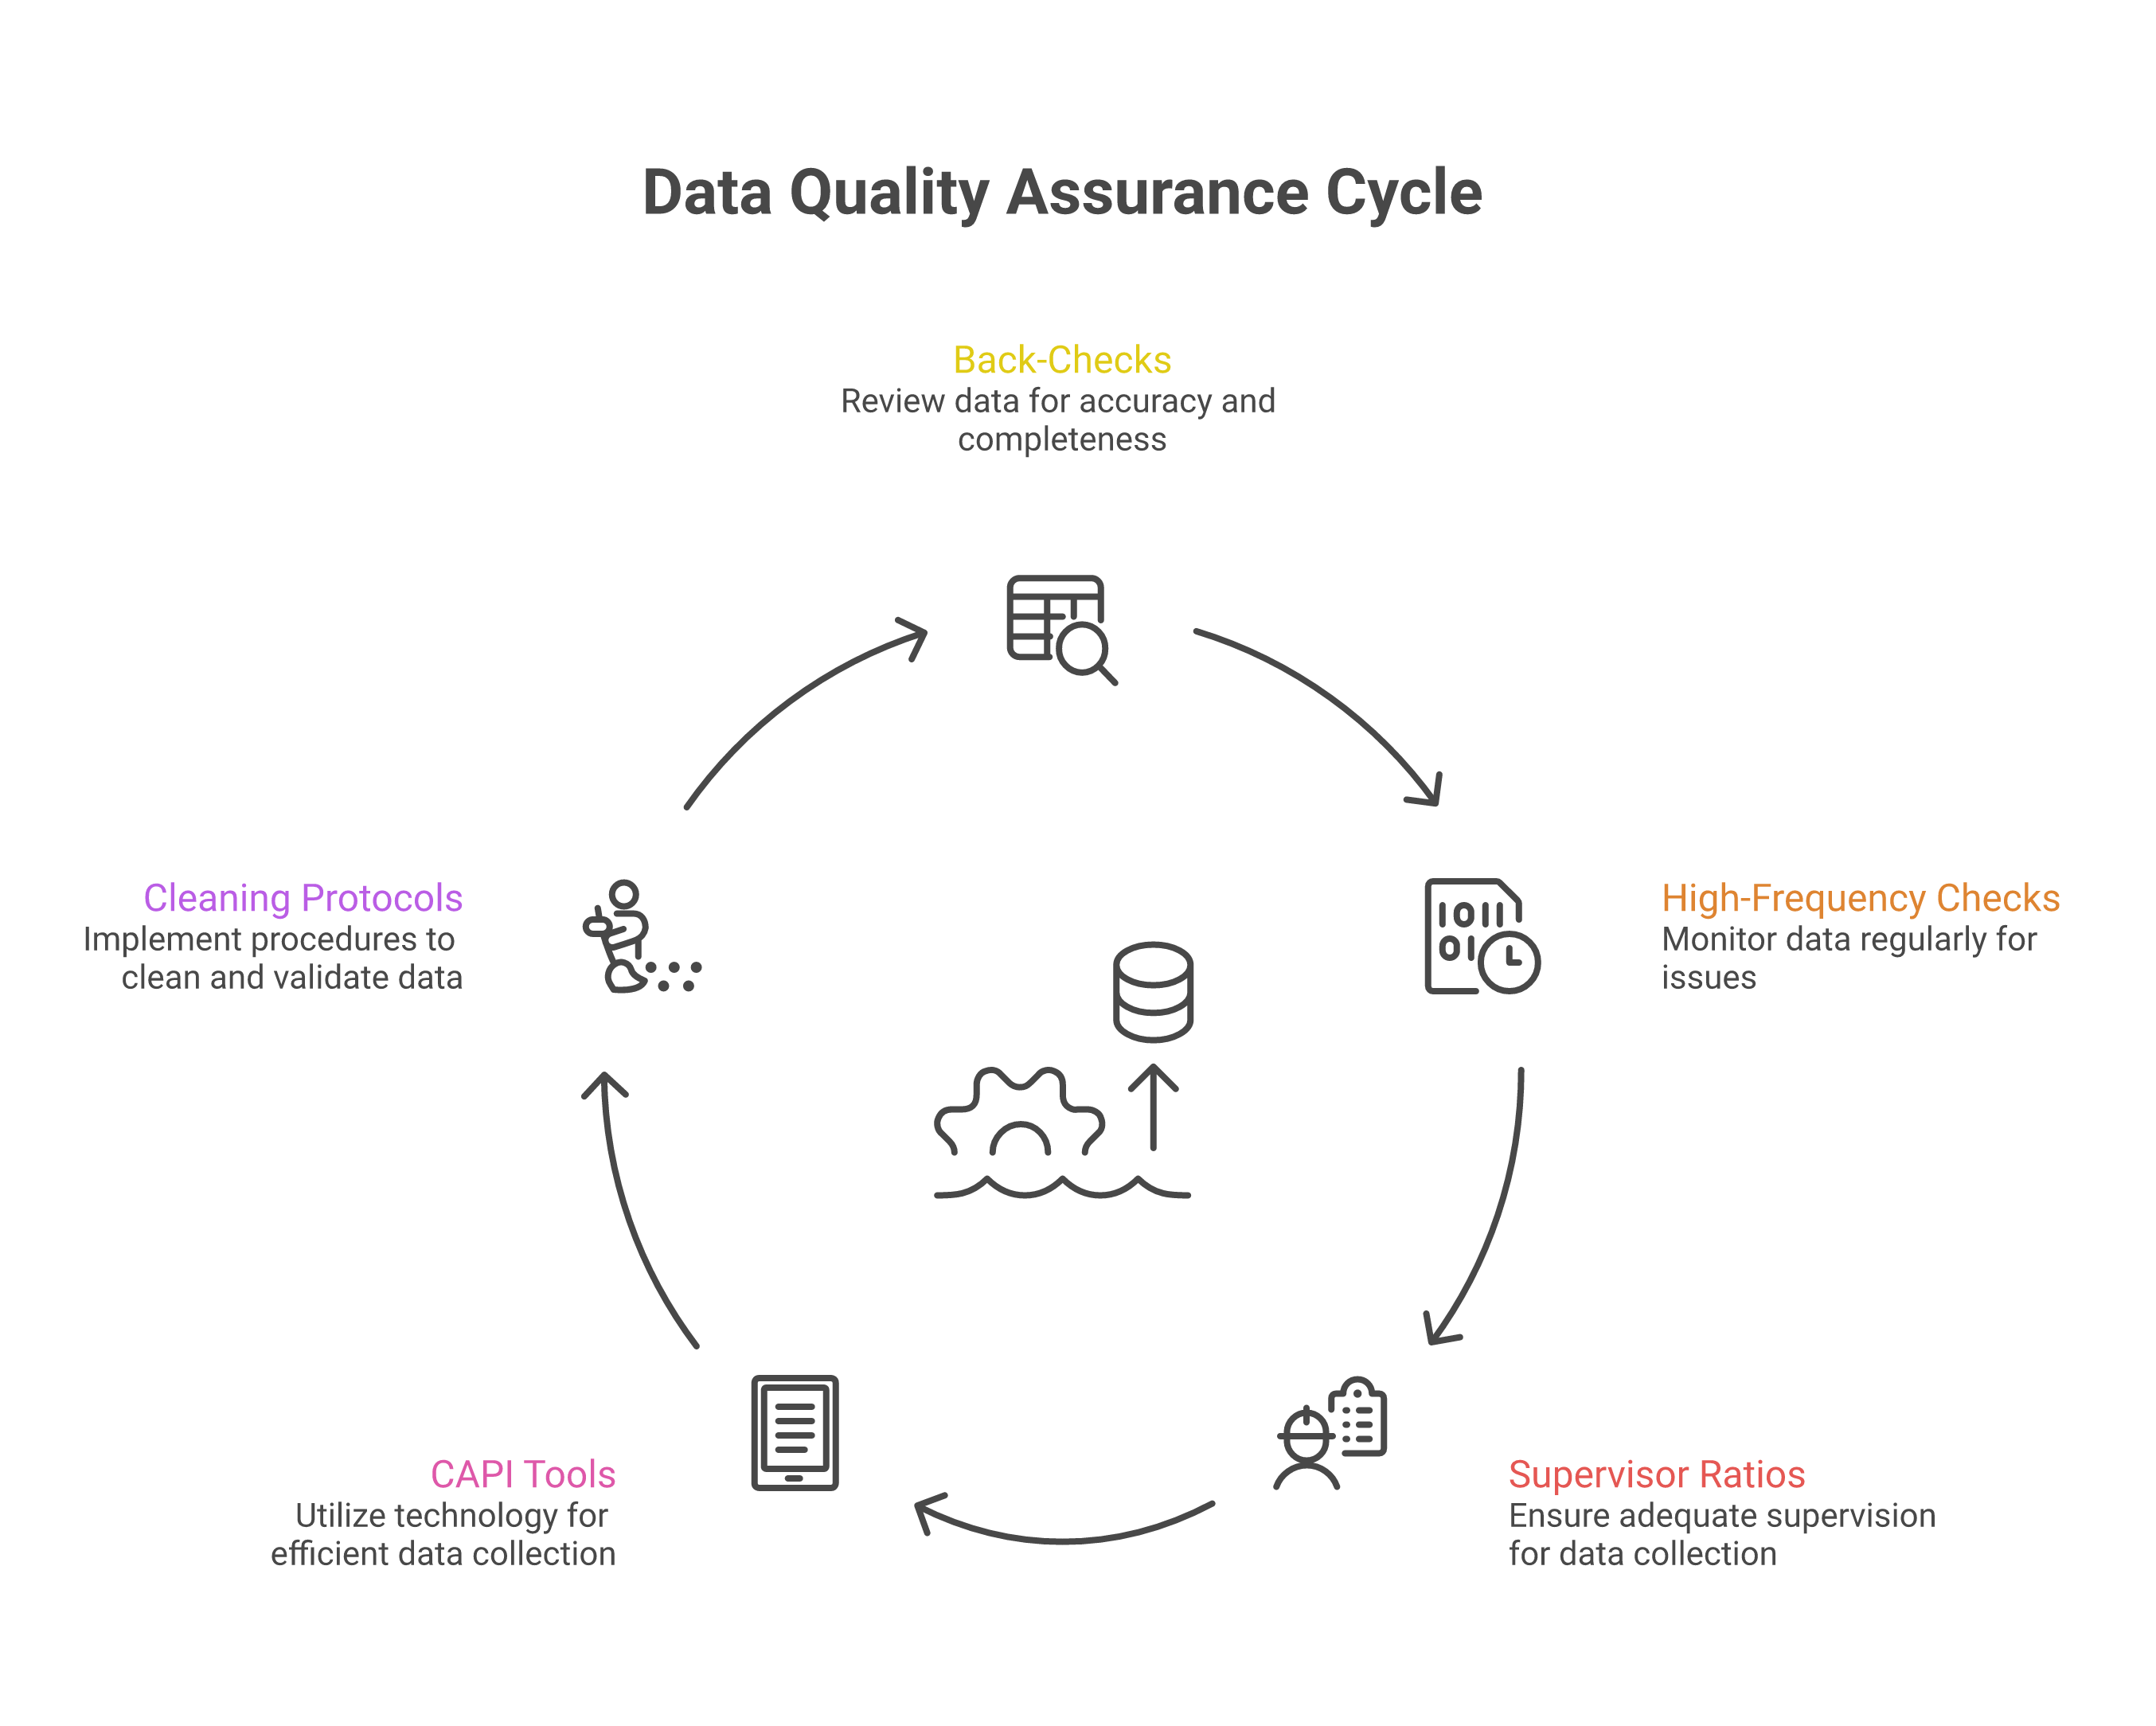
Back-checks and spot-checks remain the gold standard. J-PAL's data quality checks guidance recommends back-checking at least 10% of respondents, making sure every enumerator has at least one respondent back-checked, and documenting and reconciling any differences; the World Bank's DIME Wiki suggests pushing that share to 10 to 20%, weighted toward the first two weeks of fieldwork when problems are most fixable. Determining the right sample size for back-checks is itself a design decision worth getting right. The knowledge that back-checks will happen is itself a deterrent.
High-frequency checks (HFCs) involve reviewing incoming data daily or weekly for anomalies. The DIME Wiki advises that HFCs be designed and coded in parallel with the questionnaire itself, not bolted on afterwards. With CAPI (Computer-Assisted Personal Interviewing) tools, much of this can be automated: flagging interviews that are too short, responses that fall outside expected ranges, or enumerators whose data looks suspiciously uniform.
CAPI vs paper is no longer a close call for most contexts. As SurveyCTO documents, digital data collection through platforms like SurveyCTO, KoBoToolbox, or ODK removes the separate data-entry step where transcription errors creep in, enforces skip patterns automatically, applies range constraints in real time, and makes data available from day two rather than only after the field is closed. The main barriers, smartphone availability and digital literacy among enumerators, have largely been overcome in South Asia.
"The best data quality system is one that catches problems while you can still fix them. Documenting them after the fact comes too late."
Building quality into the design
The most effective data quality interventions happen before data collection begins. The World Bank's Development Research in Practice: The DIME Analytics Data Handbook frames this as building research around three pillars (credibility, transparency and reproducibility) that have to be designed in and cannot be patched in later. Thorough piloting in conditions similar to the actual fieldwork reveals problems that desk review cannot. Enumerator training should include extensive practice with real respondents, not just classroom role-plays. The Survey Design Lab offers a hands-on environment for testing instrument design before going to the field.
Supervisor-to-enumerator ratios matter enormously. A ratio of 1:4 or 1:5 allows real oversight. Ratios of 1:10 or higher mean supervisors become logistics coordinators and stop being quality assurance officers.
Finally, data cleaning protocols should be established before collection begins, not improvised afterwards. Deciding in advance how to handle outliers, missing values, and inconsistencies prevents ad hoc decisions that can introduce bias.
The human element
Behind every data point is a human interaction. Treating enumerators well (fair pay, reasonable workloads, real respect) directly affects data quality. Treating respondents with dignity and being transparent about how their information will be used builds the trust that honest responses require. The principles outlined in ethical research in South Asia provide essential guidance for these interactions.
Data quality is a technical problem and, fundamentally, a question of the relationships between the people who collect data, the people who provide it, and the organisations that use it. Organisations that build a real culture of learning are better positioned to treat data quality as a shared responsibility and not as a policing exercise.
To go deeper, our free Survey Design 101 deck covers instrument design and enumerator practice, and the Seeing Data course takes you from clean data to honest analysis.