The randomisation ideal and its limits
Randomised controlled trials (RCTs) are often described as the gold standard of impact evaluation. By randomly assigning participants to treatment and control groups, they remove selection bias in expectation, so a plain difference in average outcomes estimates the causal effect. Yet in the messy reality of South Asian development, randomisation is frequently impossible, impractical, or unethical.
Consider a state government rolling out a new nutrition programme across all districts simultaneously: there is no control group. Or an NGO working with trafficking survivors: randomly denying services to half the participants raises profound ethical concerns. Or a community-driven development programme where villages self-select into participation: the very act of volunteering signals motivation that confounds any comparison. In these situations, quasi-experimental designs offer rigorous alternatives that can still generate credible evidence of programme impact.
These methods do not eliminate all threats to internal validity, but when applied carefully with transparent assumptions, they provide far stronger evidence than simple before-after comparisons or cross-sectional analyses. The World Bank's practitioner handbook Impact Evaluation in Practice (Gertler, Martinez, Premand, Rawlings & Vermeersch, 2nd ed., 2016) gives regression discontinuity, difference-in-differences and matching a chapter each, and treats these designs as the standard toolkit when randomisation is off the table. For evaluation practitioners in South Asia, mastering these tools is essential for building an evidence base that policymakers can trust.
Difference-in-Differences (DiD)
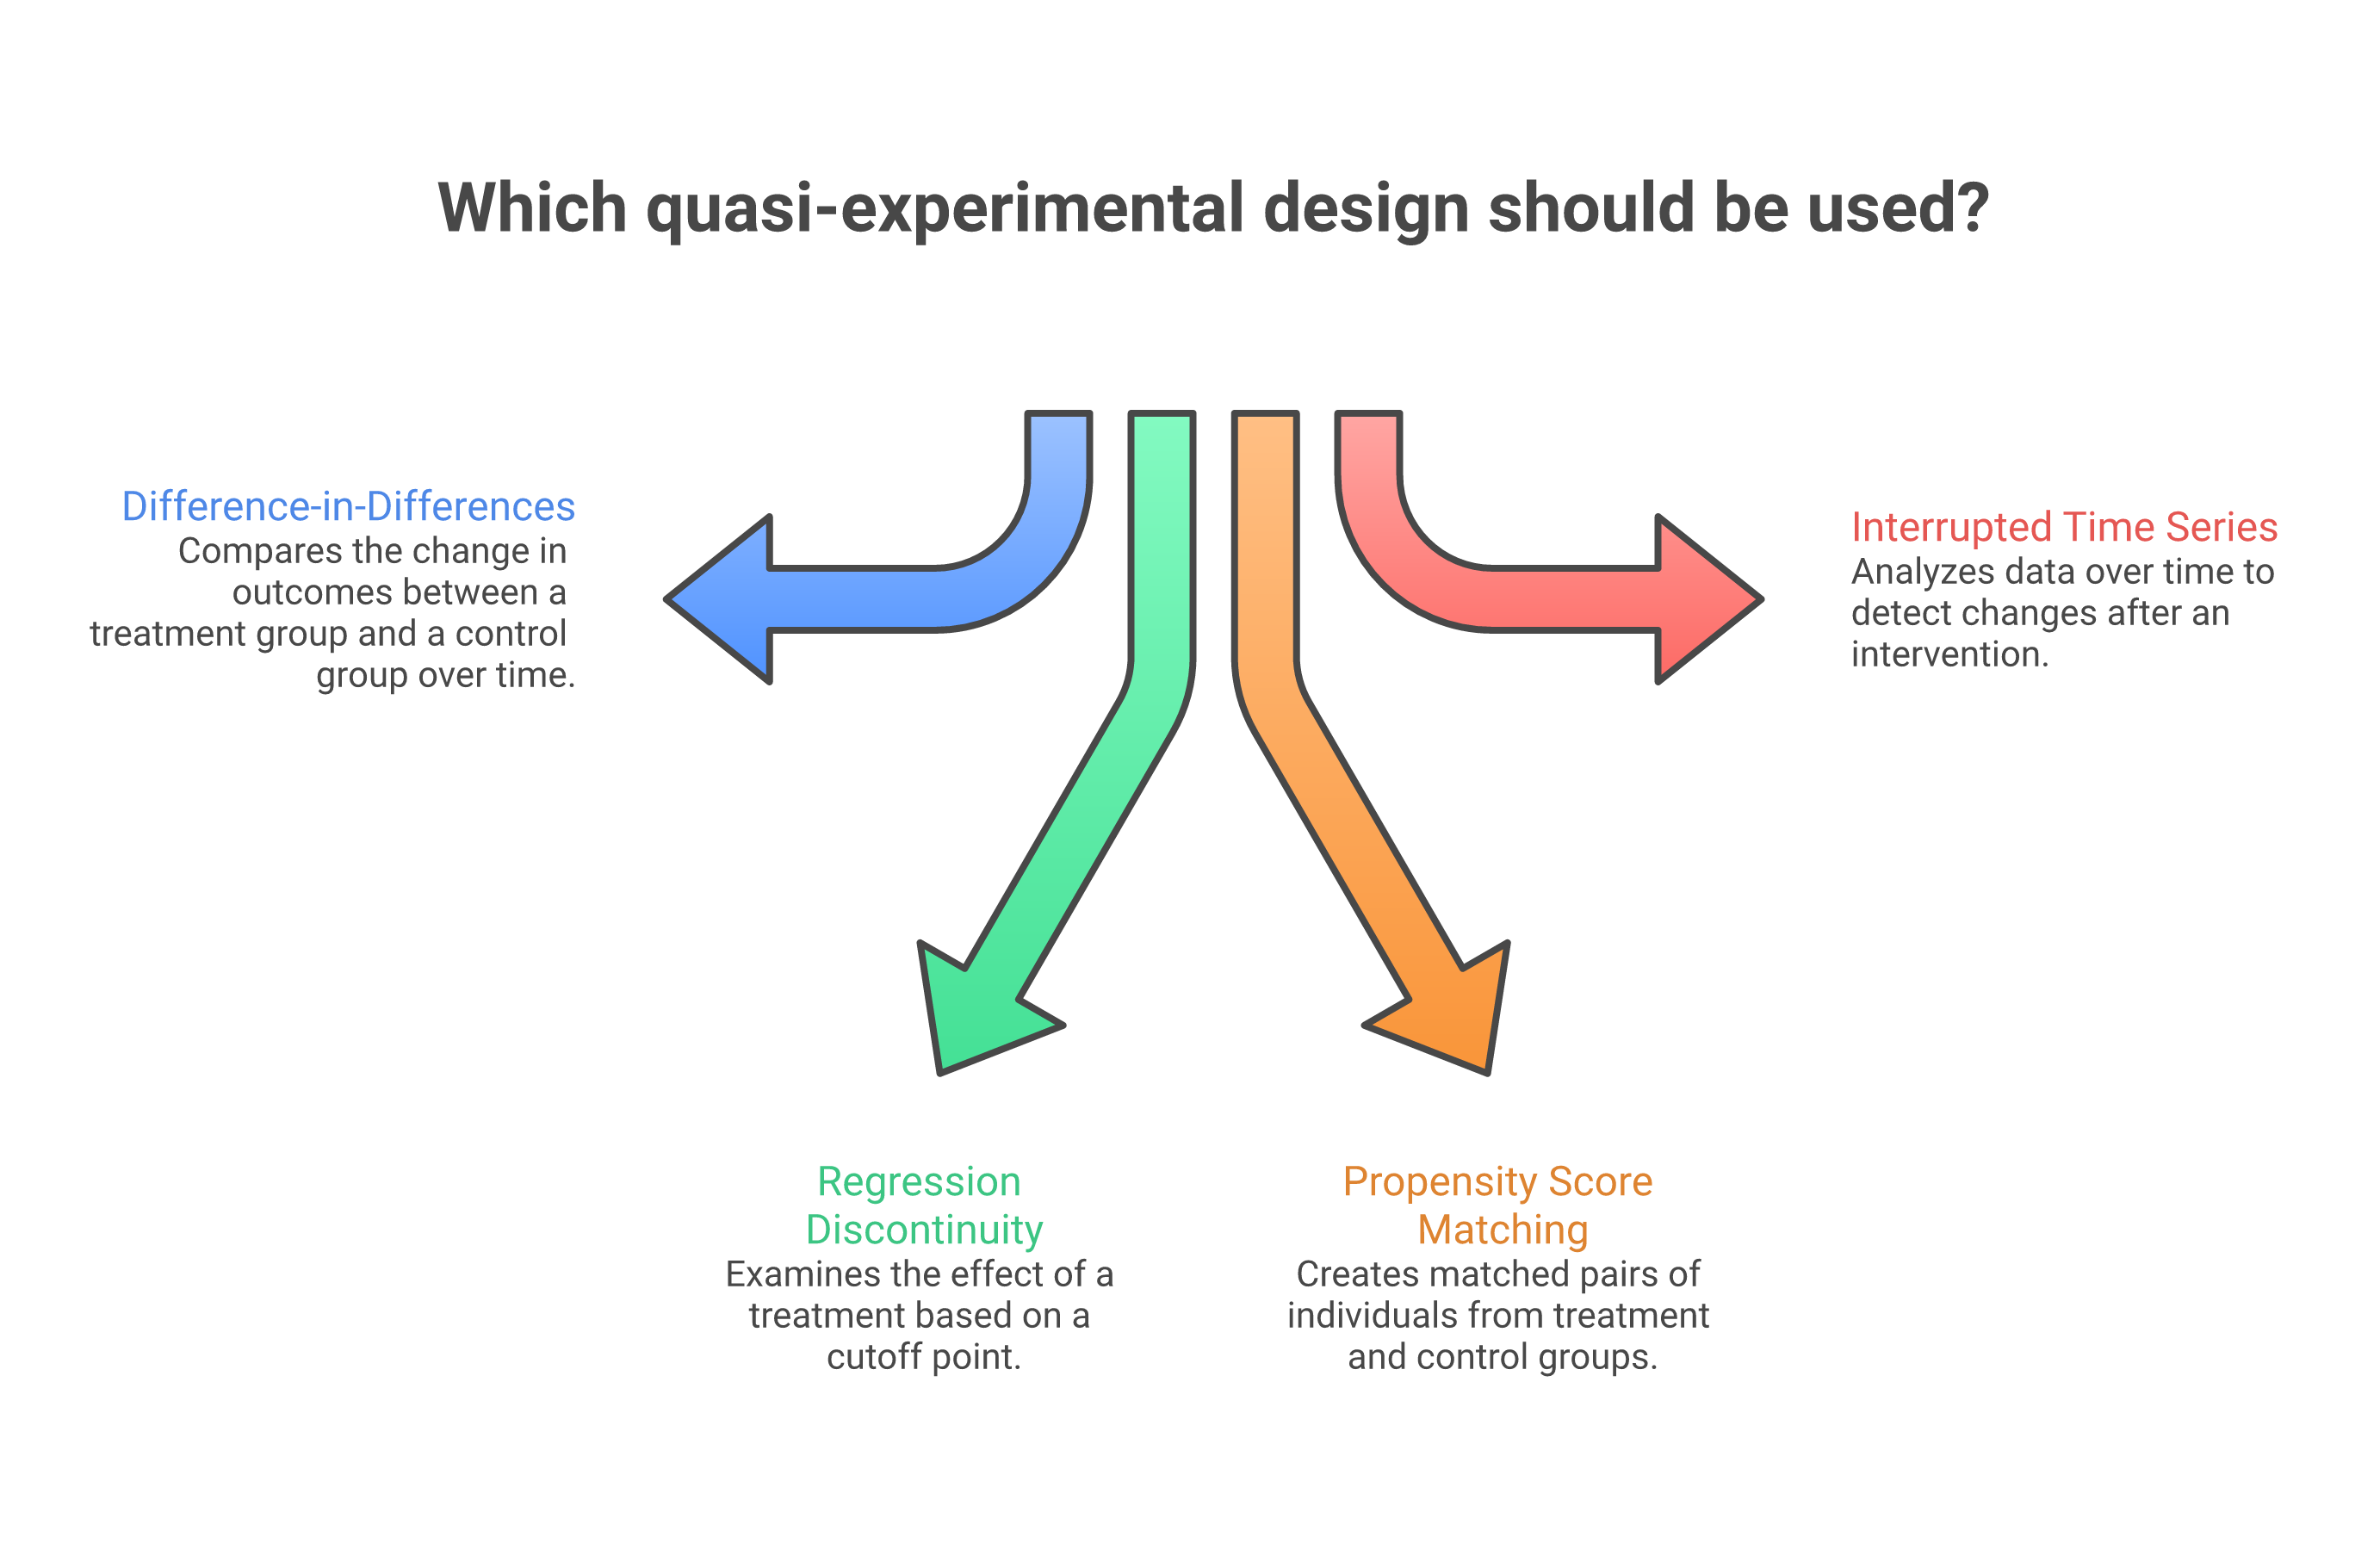
Difference-in-differences is perhaps the most widely used quasi-experimental method in development evaluation. The intuition is elegant: compare the change over time in the treatment group with the change over time in a comparison group. The "double difference" removes both time-invariant differences between groups and common temporal trends. The canonical illustration is Card and Krueger's (1994) study of the April 1992 rise in New Jersey's minimum wage from $4.25 to $5.05 an hour. It compared employment changes at New Jersey fast-food restaurants with those at Pennsylvania restaurants, where the wage did not change, and famously found no fall in employment in New Jersey.
The critical assumption is the parallel trends assumption: that in the absence of the intervention, both groups would have followed the same trajectory. This assumption cannot be directly tested for the post-treatment period, but evaluators can examine whether pre-treatment trends were parallel. If treatment and comparison districts showed similar trends in child malnutrition rates for five years before the nutrition programme launched, it is more credible to attribute post-programme divergence to the intervention.
In India, DiD has been used extensively to evaluate policy reforms. A notable example is Imbert and Papp's (2015) study of the Mahatma Gandhi National Rural Employment Guarantee Act (MGNREGA), which used the programme's staggered 2006–2008 rollout, comparing early- and late-implementation districts, as a natural experiment. Drawing on National Sample Survey data, they estimated that casual daily wages rose by 4.7 percent in early districts relative to late ones, with the results concentrated in the agricultural off-season and in the seven states that account for most of the programme's employment.
Regression discontinuity design (RDD)
Regression discontinuity exploits situations where programme eligibility is determined by a threshold on a continuous variable. Households below a poverty score receive benefits; those above do not. Students scoring above a cutoff receive scholarships; those below miss out. The key insight is that individuals just above and just below the threshold are essentially similar, any discontinuity in outcomes at the cutoff, measured through carefully chosen indicators, can be attributed to the programme. Imbens and Lemieux's (2008) "Guide to Practice" remains the standard reference for implementing the design, covering bandwidth choice, local polynomial estimation, and the validity checks that credible RDD requires.
RDD has been applied powerfully in the Indian context wherever a programme uses a sharp eligibility cutoff. Schemes such as the Rashtriya Madhyamik Shiksha Abhiyan (RMSA) secondary-education programme allocated resources using district-level criteria (for example, gross enrolment ratios below a threshold) creating exactly the kind of cutoff RDD exploits: districts just below the line received programme resources while otherwise similar districts just above it did not, so any jump in school infrastructure or enrolment at the threshold can be read as a programme effect rather than a pre-existing difference. The design fails if people can manipulate their score to land just above the line, so check how the score was recorded and by whom.
"Quasi-experimental methods do not require us to abandon the quest for causal inference (they require us to be more creative, more transparent, and more honest about our assumptions.") Martin Ravallion
Propensity score matching (PSM)
When neither a natural experiment nor a threshold exists, propensity score matching offers another path to credible comparison. PSM constructs a statistical comparison group by matching programme participants with non-participants who have similar observable characteristics: age, income, education, location, household size, and so on. The "propensity score", formalised in Rosenbaum and Rubin's (1983) foundational paper, is the predicted probability of participation given those characteristics, and matching is done on this single score rather than on each variable individually. Their key result is that conditioning on this one scalar is enough to balance all the observed covariates that went into it.
The critical limitation is that PSM can only account for observable differences. If unobserved factors (motivation, social networks, political connections) drive both participation and outcomes, PSM estimates will be biased. This is known as "selection on unobservables" and is the Achilles heel of matching methods. In the South Asian context, where social capital and caste networks often determine programme access, this limitation must be taken seriously.
Despite this caveat, PSM has proven valuable for evaluating programmes such as microfinance and self-help group interventions in South Asia, where rich baseline surveys provided extensive covariates for matching. Understanding why sample size matters and getting the sample size right is critical for the power of these analyses. The key is to combine PSM with sensitivity analyses, in the spirit of Rosenbaum's bounding approach, that assess how large an unobserved bias would need to be to overturn the findings.
Interrupted time series (ITS)
Interrupted time series analysis examines whether a policy change or programme launch altered the level or trend of an outcome measured repeatedly over time. Unlike DiD, ITS does not require a comparison group: it uses the pre-intervention trend as the counterfactual. This makes it particularly useful for evaluating national policies that affect everyone simultaneously.
In South Asia, ITS has been applied to evaluate the impact of India's Swachh Bharat Mission on sanitation outcomes, using district-level monthly data on toilet construction and open defecation rates. The analysis examined whether the campaign's launch in 2014 produced a discontinuous jump in sanitation indicators beyond the pre-existing trend. Similar approaches have evaluated Bangladesh's tobacco control legislation and Sri Lanka's post-tsunami reconstruction policies.
ITS suits a policy that took effect on a known date and has a long, regular series before it, such as monthly admissions, enrolment or registrations. The test is whether the series changed in level or slope after that date, beyond its earlier trend.
The main threat to ITS validity is co-occurring events. If another programme launched at the same time, or if an economic shock coincided with the intervention, attributing the change solely to the programme becomes problematic. Adding a comparison series, a similar outcome that should not have been affected by the intervention, strengthens the design considerably. When the unit of analysis is a single state or region, the synthetic control method offers a disciplined way to build that comparison: Abadie and Gardeazabal (2003) estimated the economic cost of conflict in Spain's Basque Country by constructing a weighted "synthetic" combination of other regions whose pre-conflict trajectory matched the Basque economy, then reading the gap that opened after the outbreak of terrorism in the late 1960s, about 10 percentage points of per capita GDP, as its effect. The same logic applies to a single Indian state adopting a reform ahead of its neighbours.
Strengthening quasi-experimental evidence
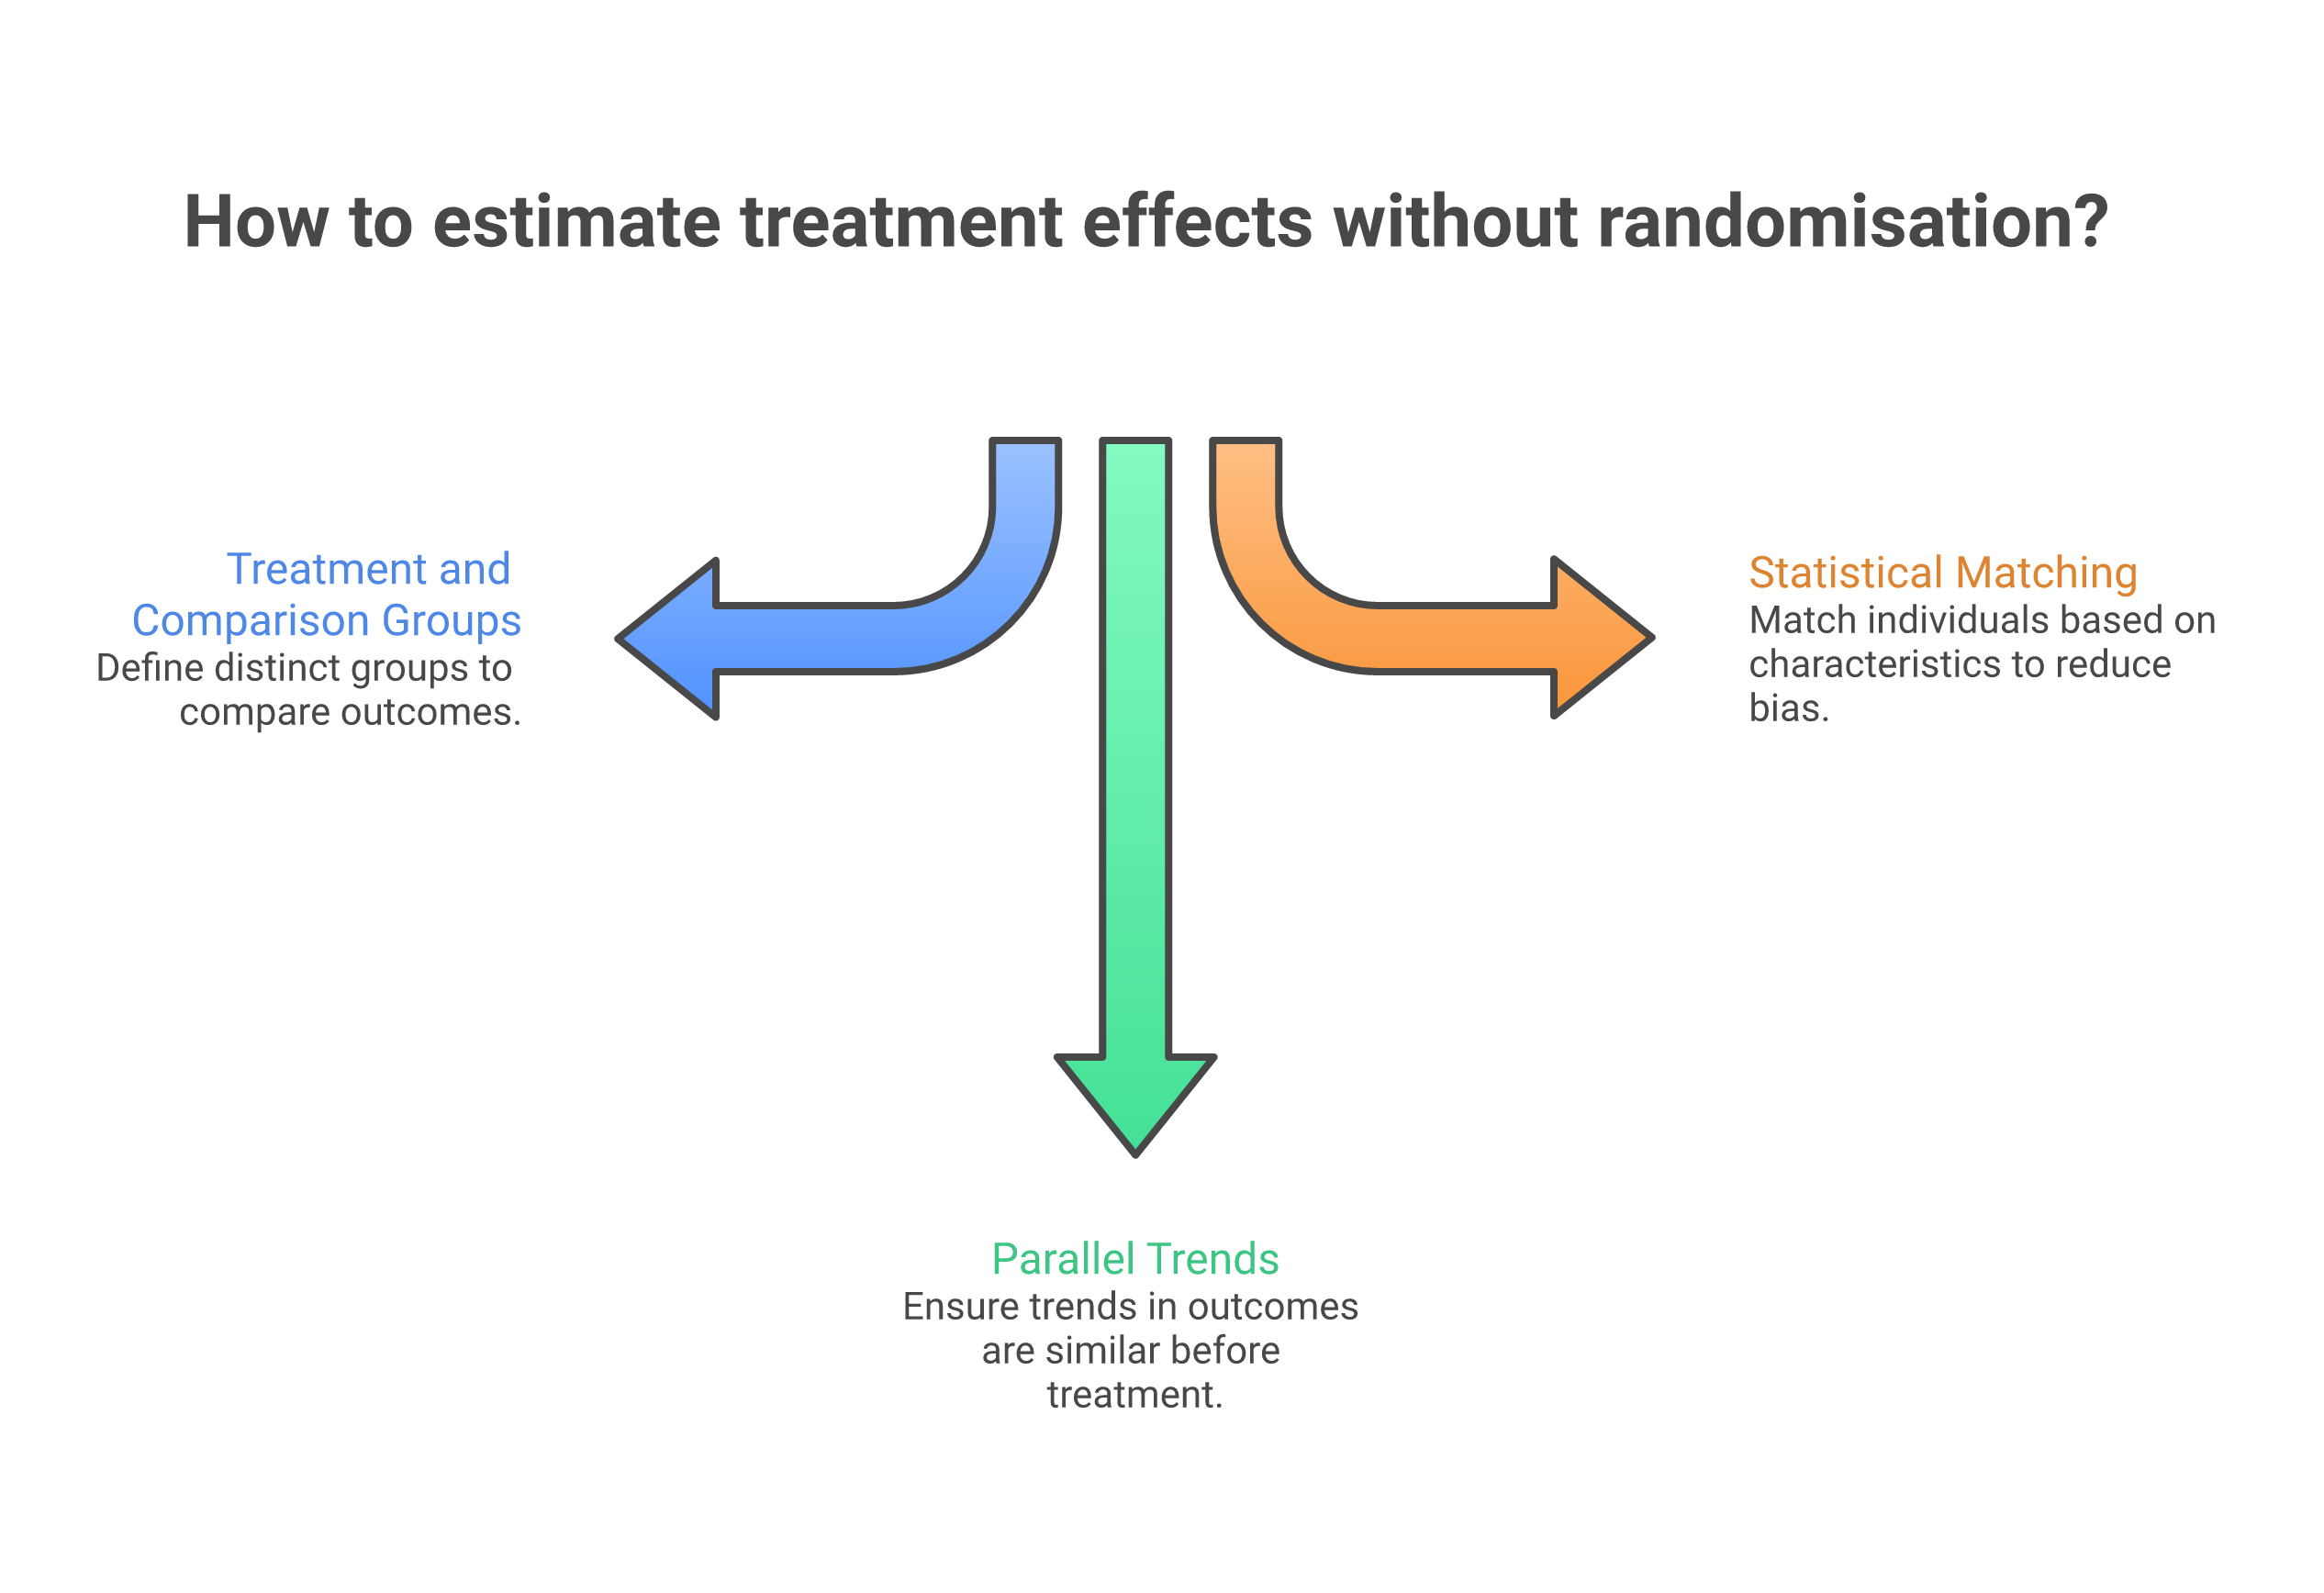
No single quasi-experimental method provides the same internal validity as a well-implemented RCT. For the econometrics behind each of these designs, see Angrist and Pischke's Mostly Harmless Econometrics (2009), which remains the standard practitioner's companion to the methods above. Several strategies can strengthen the credibility of quasi-experimental findings. Triangulation across methods, applying DiD and PSM to the same programme and checking whether results converge, builds confidence, echoing the broader case for mixed methods in evaluation. Placebo tests, checking whether the intervention appears to affect outcomes it should not influence, can rule out spurious findings. Sensitivity analyses (examining how far results move under different specifications, matching algorithms, or bandwidth choices) demonstrate transparency.
For the South Asian evaluator, the practical message is clear: quasi-experimental methods are appropriate tools, and no second-best alternative to RCTs, for the vast majority of real-world evaluation situations. The key is to choose the right design for your context, be transparent about assumptions, and invest in the data quality that these methods demand. A well-executed DiD or RDD study with transparent assumptions will always be more useful than a poorly implemented RCT with high attrition and contamination.
To learn these designs properly, work through our free course Causal Inference for Development, or start with the shorter Impact Evaluation 101 deck.